Colonel Server

360 Monitoring – Website & Server Monitoring

360 Monitoring provides the insights you need to deliver a fast, stable, and reliable online experience to your customers

✅ Proactive issue detection before they affect your users

✅ Comprehensive server health tracking from one unified dashboard

✅ Scalable plans to fit businesses of all sizes

✅ Easy setup with no complex configuration required


360-monitoring-product

PRO
360monitoring

€4.10/mo

Get started with essential infrastructure and website monitoring. ideal for freelancers, small businesses, or developers managing personal projects.

Purchase Plan
  • 1 server and 20 websites
  • Real-time server metrics
  • Uptime and response time monitoring
  • Alerting via email, Slack, and more
  • Custom dashboards
  • Includes Plesk integration

Business
360monitoring

€28.60/mo

advanced tools tailored for growing teams and digital agencies.

Purchase Plan
  • 10 server and 200 websites
  • Everything in Pro
  • Log retention and historical analytics
  • Multi-location monitoring
  • Role-based access controls
  • Status pages for clients and team

Enterprise
360monitoring

€114.40/mo

Enterprise-grade visibility and control perfect for large providers and SaaS environments.

Purchase Plan
  • 100 server and 2000 websites
  • Everything in Business
  • API access for integration
  • Custom alert rules and escalation policies
  • Enhanced SLA and support levels
  • Full white-labeling capabilities

Features of 360 Monitoring

Site Monitoring

360 site monitoring tracks uptime, response times, and functionality for protocols like HTTPS, TCP, and ICMP, ensuring your website remains accessible. You receive alerts for downtime or slow load times, enabling quick fixes to maintain user satisfaction.

Server Monitoring

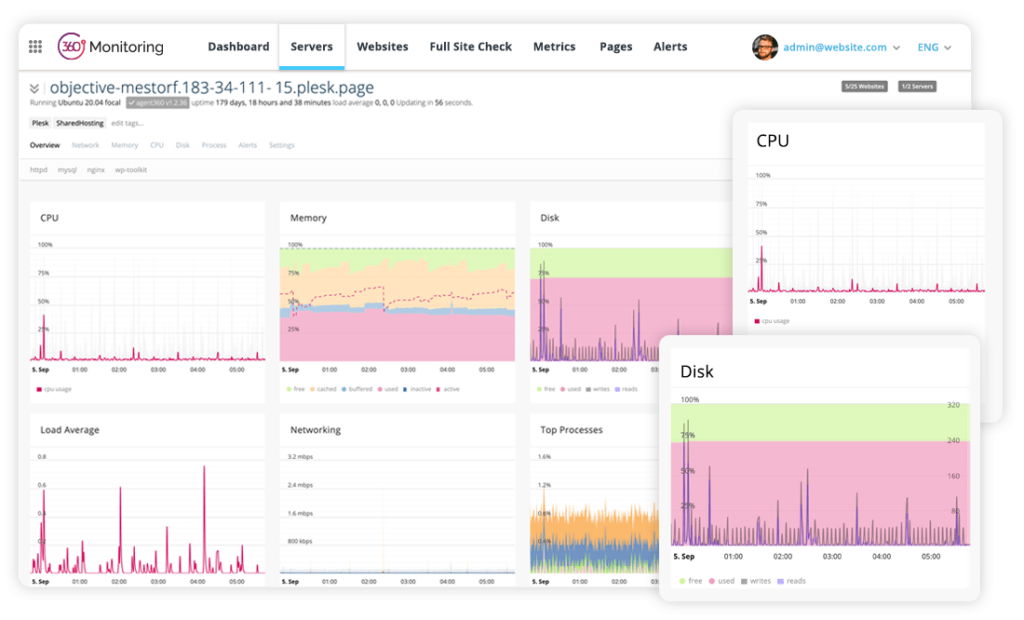
Server monitoring in 360 provides detailed metrics on CPU, memory, disk usage, and network traffic via the Agent360 agent. You can identify resource bottlenecks, such as high memory usage, and optimize server performance proactively.

Security Monitoring

Security monitoring scans for malware, tracks suspicious logins, and monitors SSL certificate validity, protecting your site from threats. You stay ahead of vulnerabilities, ensuring customer data remains secure and compliant with standards like GDPR.

User Behavior and Analytics Monitoring

User behavior monitoring in 360 Monitoring analyzes metrics like bounce rates and click patterns, providing insights to improve engagement. You can optimize page layouts based on heatmaps, enhancing user experience and conversions.

Alerts & Notifications

This feature delivers instant alerts via email, SMS, Slack, or Telegram for issues like downtime or performance drops. You can respond immediately to prevent disruptions, with customizable alert settings to match your needs.

Integration with Hosting Panels

360 Monitoring integrates seamlessly with cPanel, Plesk, and WHMCS, offering centralized control within your hosting environment. You can manage monitoring directly from your hosting dashboard, simplifying workflows.

Comprehensive Server Uptime Monitoring

Easily track CPU performance, network activity, disk usage, load times, and more — all with just a click.

Gain deep insights into your servers. With 360 process monitoring, you can monitor the health of every component, helping you identify the exact cause of errors and downtime.

Fully compatible with both Windows and Linux environments.

Comprehensive Server Uptime Checks
Complete Website Uptime Monitoring

Complete Website Uptime Monitoring

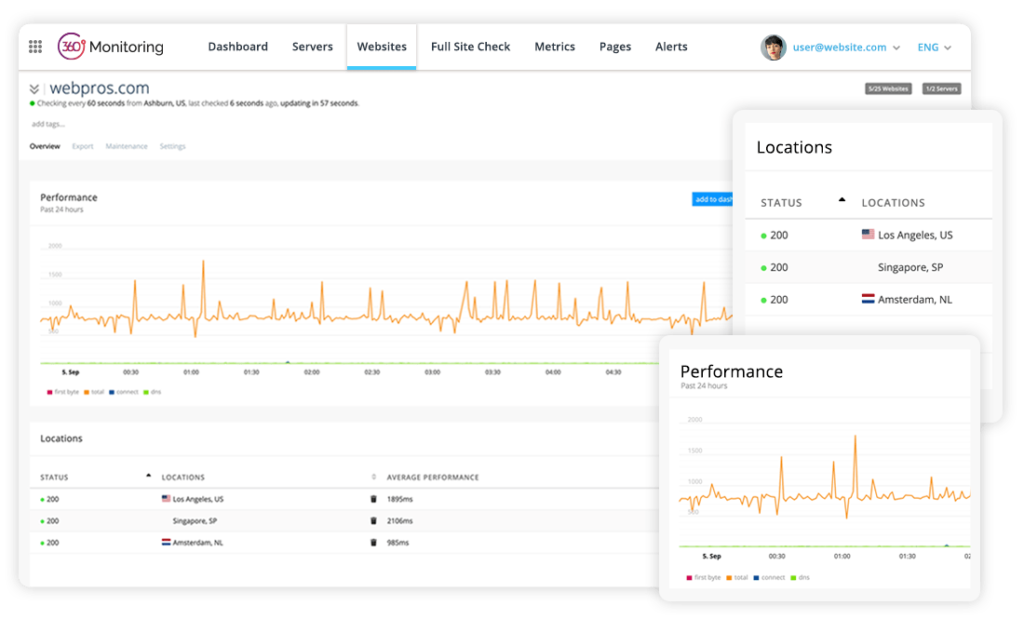
Say goodbye to unnoticed downtime with 360 Site Monitoring. Track DNS resolution time, verify SSL certificate validity, monitor keywords, and more — all tested from 26 global locations for accurate, real-time results.

Frequent Scans & Customized Alerts

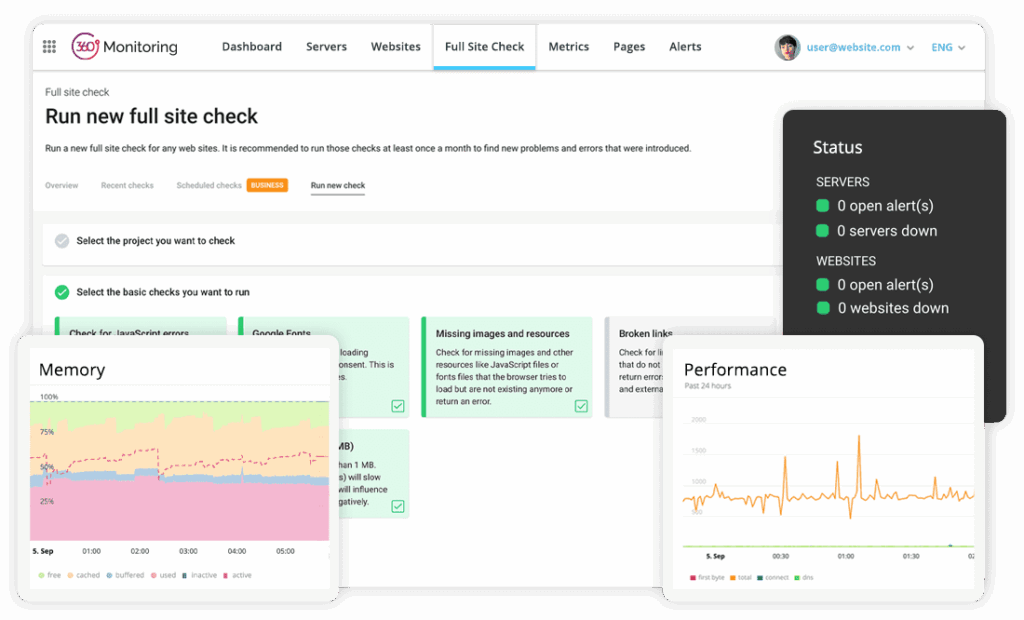
Stay informed at all times with 360 Monitoring. The moment an issue is detected, you’ll receive an instant alert via your preferred notification channel. Enjoy monitoring intervals as short as 60 seconds, data retention for up to 30 days, and access to historical performance data for as long as 2 years.

Frequent Scans & Personalized Alerting

The Power of 360 Uptime Monitoring

Keep track of your online business assets with confidence, supported by world-class internal and external system monitoring.

pointer

Monitoring Intervals

Perform frequent scans as often as every 60 seconds for real-time performance insights.

database

Historical Reporting

Review and analyze up to 2 years of detailed monitoring reports to track long-term trends.

database

Data Retention

Store and access monitoring data from the past 30 days for quick troubleshooting and performance checks.

360Monitoring_Dashbaord-colonel_
ds cta dots

Why Use 360 Monitoring

icon 01
Easy Performance Management

Monitor your websites and servers effortlessly through a simple, intuitive dashboard. View uptime, response times, and performance metrics in real-time without complex setup.

icon 02
Hassle-Free Configuration

Set up monitoring for any website or server in minutes — no advanced technical skills required. Supports HTTP, HTTPS, ICMP (Ping), and custom ports for flexible tracking.

icon 03
Smart Alert Automation

Receive instant alerts via email, SMS, or integrated apps when downtime or performance issues occur. Customize alert rules to match your needs and avoid unnecessary notifications.

icon 04
Advanced Monitoring Tools

Track CPU, RAM, disk usage, network stats, and process health. Detect issues before they cause downtime with proactive monitoring of server resources.

icon 05
Full Activity Logs & Historical Data

Access detailed monitoring logs and review historical performance reports. Analyze trends with up to 2 years of data to optimize uptime and reliability.

icon 06
Scalable Monitoring Plans

Easily expand your monitoring coverage as your business grows. Add more servers, websites, and custom checks — all managed from one central dashboard.

Website Monitoring vs. Server Monitoring

Website monitoring in 360 Monitoring tests your site’s uptime, responsiveness, and functionality, while server monitoring tracks underlying server resources like CPU, memory, and disk usage. Website monitoring ensures your site is accessible and performs well for users globally, using cloud-based checks from multiple locations.

Server monitoring, facilitated by the Agent360 agent, provides detailed insights into server health, such as process performance and network traffic. For instance, website monitoring can alert you if a checkout page fails, while server monitoring identifies if high CPU usage is the cause, allowing targeted fixes.

Technical Details and Advanced Features

360Monitoring provides a comprehensive set of advanced technical features, including detailed monitoring of web server processes, databases, mail servers, and specialized environments like PHP-FPM and Docker, delivering granular insights into your infrastructure’s performance.

These capabilities allow you to diagnose complex issues with precision, optimize resource usage, and maintain seamless operations across your entire stack, from web applications to backend systems, ensuring reliability for mission-critical platforms.

Process Monitoring (NGINX, Apache, LiteSpeed)

Process monitoring meticulously tracks web server processes, such as NGINX, Apache, and LiteSpeed, analyzing metrics like CPU usage, memory consumption, and process counts to identify inefficiencies or bottlenecks. You can detect issues like a misconfigured NGINX process causing slow page loads or an Apache thread consuming excessive resources, enabling targeted optimizations.

If your WordPress site experiences delays due to high LiteSpeed process activity during a traffic surge, 360 Monitoring provides detailed reports on CPU and memory usage, allowing you to adjust configurations or scale resources to restore performance. This ensures your web server operates efficiently, supporting high-traffic scenarios without compromising user experience.

Database Monitoring (MySQL, MariaDB, MongoDB, Redis)

Database monitoring oversees critical databases like MySQL, MariaDB, MongoDB, and Redis, tracking query performance, connection times, and resource usage to ensure optimal operation in 360 Monitoring. You can identify slow queries, such as a poorly indexed MySQL query slowing product searches on an e-commerce site, or excessive Redis memory usage affecting caching performance.

Mail Server Monitoring (Exim, Postfix, IMAP, SMTP)

This technical feature in 360Monitoring ensures reliable email delivery by tracking performance metrics for Exim, Postfix, IMAP, and SMTP servers, including mail queue length, delivery times, and error rates.

You receive immediate alerts for issues like a backlog in the Exim mail queue or SMTP connection failures, preventing disruptions in customer communications, such as order confirmations or password reset emails. So it maintains seamless email operations, enhancing customer trust and engagement.

PHP-FPM, CloudLinux, and Docker Monitoring

360 Monitoring tracks PHP-FPM, CloudLinux, and Docker environments, monitoring resource allocation, process performance, and container health to ensure stability for web applications. You can optimize PHP-FPM processes to reduce latency in WordPress sites or isolate resource-heavy Docker containers running custom applications.

This ensures consistent performance for complex applications, preventing slowdowns or crashes during high-demand periods.

Queue, ElasticSearch, HaProxy, Asterisk Monitoring

360 Monitoring supports advanced monitoring for Queue systems, ElasticSearch, HaProxy, and Asterisk, providing insights into task queues, search performance, load balancing, and VoIP operations. You can track queue backlogs affecting task processing, optimize ElasticSearch for faster product searches, ensure HaProxy balances traffic efficiently, or monitor Asterisk for reliable call handling.

How 360 Monitoring Works

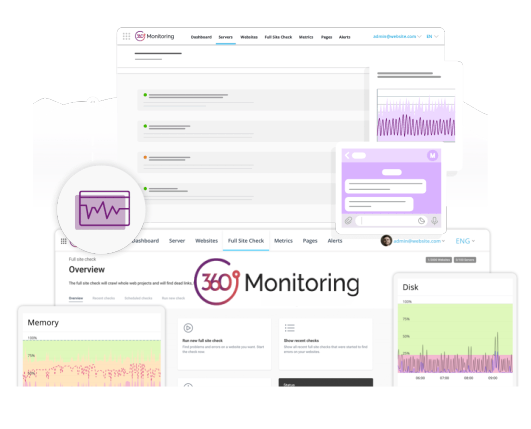
360 Monitoring brings website availability checks and server performance data into a central dashboard. Use it to spot service interruptions, investigate slow responses, and track resource usage across your hosting environment.

Website Checks

External checks test whether your website responds and record its response time. Configure the sites and checks you need, then review incidents and performance trends from the dashboard. These checks help you see availability from outside your own server.

Server Monitoring

A monitoring agent collects server metrics such as CPU, memory, disk, and network usage. This gives you context when a website becomes slow or unavailable. Review the installation requirements for your operating system before enabling the agent.

Alerts and Reporting

Set alert thresholds and notification channels so the right people can respond when a check fails or resource usage rises. Historical reports help you compare recent behaviour with earlier periods and investigate recurring issues.

Monitoring frequency, retention periods, check limits, and available features depend on the selected plan. Choose a plan that matches the number of websites and servers you operate, and review the included limits before ordering.

Do You Have Questions?

360Monitoring FAQs

Find clear answers to the most frequently asked questions about our 360Monitoring

360 Monitoring is a real-time website and server monitoring solution that tracks uptime, performance, and resource usage to ensure maximum reliability

You can monitor websites, servers, network services, and custom ports. It also tracks CPU, RAM, disk usage, and process health.

Monitoring intervals can be set as frequently as every 60 seconds for near real-time updates

Yes, you can receive instant alerts via email, SMS, or integrated apps like Slack, Telegram, or Microsoft Teams.


Yes, it’s fully compatible with both Linux and Windows environments

360 Monitoring is a real-time website and server monitoring solution that tracks uptime, performance, and resource usage to ensure maximum reliability

Yes, uptime and performance tests are performed from 26 global locations for accurate results

Data from scans is stored for 30 days, with historical reports available for up to 2 years

No, setup is quick and user-friendly. You can start monitoring in just a few minutes without advanced technical skills

Yes, you can easily add more servers, websites, and checks to your account at any time